7.6.1 Definitions
Serological protection (efficacy) has to be distinguished from that obtained when using the vaccine under real conditions (effectiveness):
- Efficacy, which is measured under randomised clinical trial conditions, means that the vaccine has demonstrated its immunogenicity, that is, its ability to protect.
- Vaccine effectiveness means that the vaccine has demonstrated its ability to protect under real-life conditions. It reflects the clinical efficacy of the vaccine, the characteristics of the individual vaccinated (age and immune status) and programme errors (cold chain and vaccine preparation and administration technique).
7.6.2 When to calculate vaccine effectiveness?
The effectiveness of the vaccine under real conditions is calculated in the following situations:
- when an outbreak occurs in a correctly-vaccinated population (very high vaccination coverage);
- when there is no reduction in measles incidence despite high vaccination coverage;
- when there are a significant percentage of vaccinated people among measles cases;
- when a new vaccine is introduced.
7.6.3 Principle
The percentage reduction in the attack rate is calculated for those vaccinated versus those not vaccinated. This yields the preventive fraction in the vaccinated group. The formula is:
NVAR − VAR
VE (in %) = ––––––––––––––
NVAR
| VE | Vaccine effectiveness |
| NVAR | Attack rate among the unvaccinated |
| VAR | Attack rate among the vaccinated |
The study should be done quickly (ideally in about ten days).
7.6.4 Validity
The reliability of effectiveness studies and the validity of the results depend on several factors:
- The case definition should be standardised and applied uniformly.
- The search for and identification of cases should be identical and as exhaustive as possible for the population being studied.
- Determination of vaccination status must be rigorous for both patients and non-patients. Ideally, the vaccination status is established by presentation of a card indicating the vaccination date.
- The risk of exposure to the disease should be comparable in the two groups (vaccinated and unvaccinated).
- The vaccination coverage data should be as reliable as possible.
7.6.5 Study sample
The sample should be representative of measles cases as a whole; study a group of patients from facilities at all levels (outpatient clinics and hospitals).
The sample will depend on the type of programme being evaluated:
| Programme | Inclusion period |
|---|---|
|
Routine immunisation programme (children vaccinated by the EPI prior to the vaccination campaign) |
Include only measles cases that occurred before the vaccination campaign. |
| Outbreak response vaccination campaign |
Include only measles cases that occurred more than two weeks after the campaign |
|
Comprehensive, all strategies combined (EPI, SIA, outbreak response) |
Include all measles cases. |
Inclusion criteria
- Suspected case of measles (case definition)
- Measles case belonging to the age group being studied
- Measles case reported in the defined geographic area
- Measles case whose vaccination status is known (card presented)
Exclusion criteria
- Uncertainty about the diagnosis
- Age not known
- Measles case living outside the defined geographic area
- Measles case whose vaccination status is not known (no card)
7.6.6 Measurement methods
Three methods are currently used: the rapid estimation method, cohort studies and casecontrol
studies. The last two require a specialised epidemiology team.
Rapid estimation method
This is the easiest first-line method for identifying a problem with vaccine effectiveness and deciding whether to do a more in-depth evaluation.
If possible, use vaccination coverage data from surveys for the calculation. Otherwise, use the estimated vaccination coverage (administrative).
The effectiveness is estimated based on the percentage of the population vaccinated (measles vaccination coverage) and the percentage of vaccinated among the measles cases:
PPV − PCV
VE (en %) = ––––––––––––––––––
PPV x (1 – PCV)
| VE | Vaccine effectiveness |
| PCV | Percentage of cases vaccinated |
| PPV | Percentage of the population vaccinated |
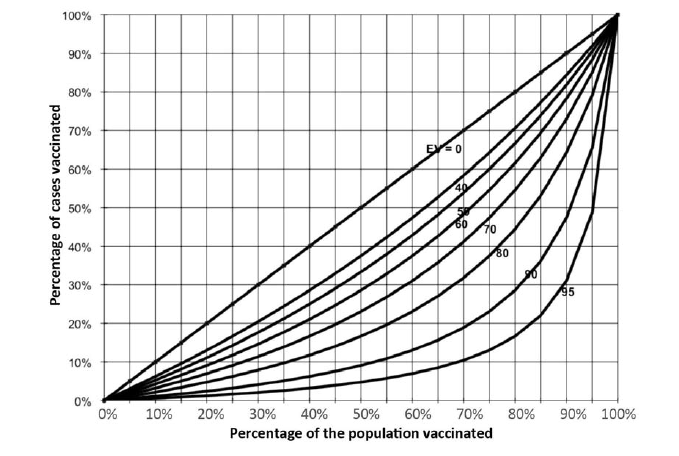
The curves generated by this equation (nomogram) allow rapid evaluation of vaccine effectiveness.

If the result is ≥ 80%, one can assume that there is no vaccine effectiveness problem.
If, on the other hand, the calculated vaccine effectiveness is < 80%, evaluation with a more accurate method (cohort or case-control study) is needed.
Note, however, that when coverage is low this method yields a biased estimate of vaccine effectiveness.
Example: a vaccination campaign was conducted 9 months ago. An vaccination coverage survey showed that 85% of the target population was vaccinated (PPV = 85%). Some measles cases have been reported; half of them were vaccinated during the campaign (PCV = 50%).
EV = [0.85 - 0.50] / 0.8 x (1 - 0.5) = [0.35] / (0.425) = 82%
Drawing a straight vertical line from 85% on the x-axis and a straight horizontal line from 50% on the y-axis, the two lines intersect in the vaccine effectiveness region between the 0.8 and the 0.9 curves, consistent with the value obtained by calculation.
Cohort study
This complex method allows comparison of the attack rates among the vaccinated (VAR) and the unvaccinated (NVAR) and calculation of the relative risk, that is, the difference in the risk of developing the disease when vaccinated. The formula is as follows:
VAR
Relative risk = –––––––––
NVAR
or
VE (%) = (1 – relative risk) x 100
Example:
Measles attack rate among the vaccinated (VAR) = 1%
Measles attack rate among the unvaccinated (NVAR) = 7%
Relative risk = 0.01/0.07 = 0.14 or VE = 1 – 0.14 = 86%
Case-control study
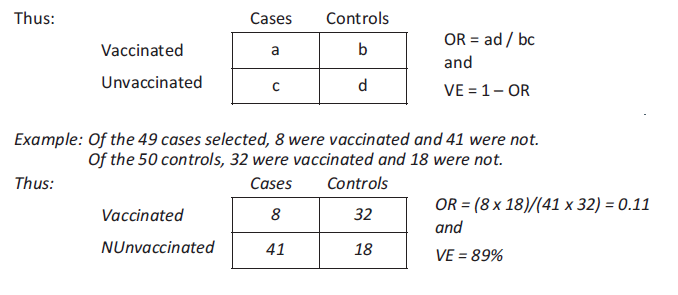
This study compares the vaccination status of a sample of cases and controls. It does not study the at-risk population. The cases represent a sampling fraction of all measles cases, and the controls represent a sampling fraction of the population that did not get the disease. For each case, at least one matched control (in terms of age, gender, place of residence, initial health status, etc.) is chosen at random.
Knowing the vaccination status of the cases and controls allows estimation of the relative risk (comparing the attack rate for the vaccinated to the attack rate for the unvaccinated) by measuring the odds ratio (OR).
