1.2.1 Incidence and vaccination
According to the WHO, worldwide measles vaccination coverage in 2022 had reached 83% for the first dose and 74% for the second dose (Figure 1.5). However, only 34% of the world’s countries had achieved 95% or greater vaccination coverage for the first dose.
Figure 1.5 - Number of reported cases by year and measles vaccination coverage for 1st and 2nd dose (MCV1 and MCV2), 1994-2023
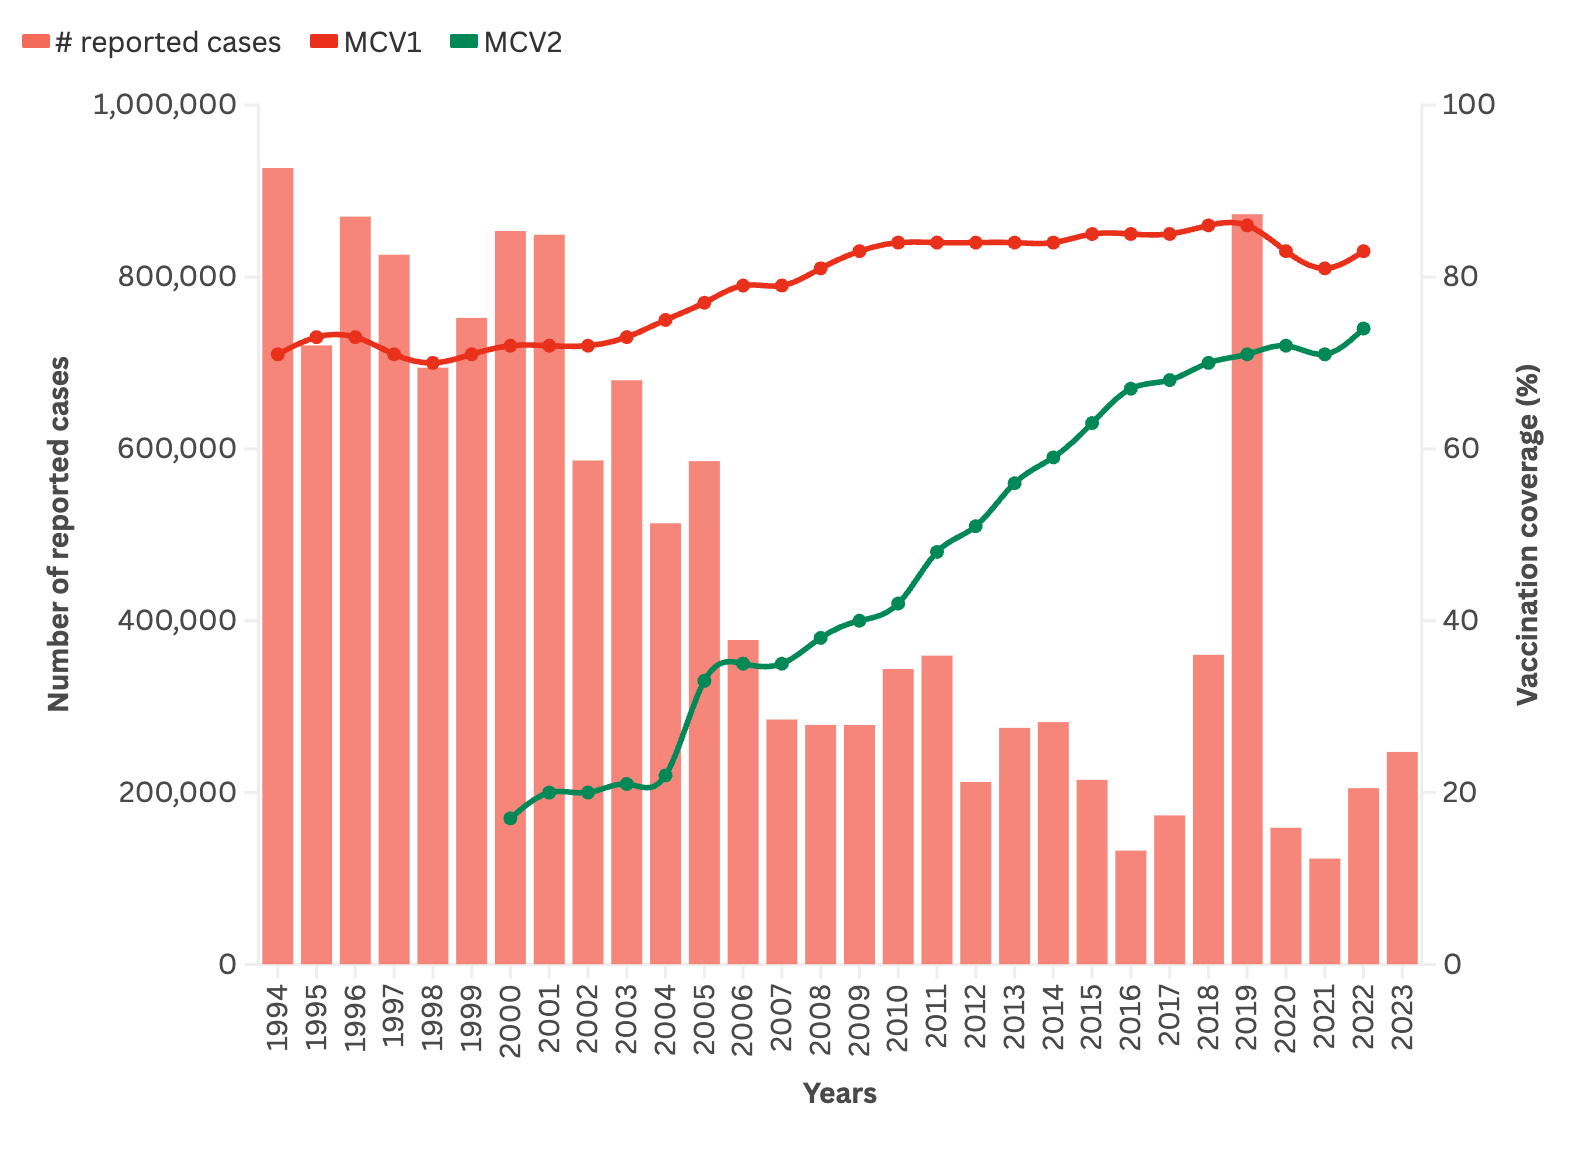
Source: graphs and curves generated based on data from the WHO website
[1]Citation 1.WHO Immunization Data portal - Detail Page. Immunization Data. Accessed April 2, 2024.
https://immunizationdata.who.int/global/wiise-detail-page/measles-vaccination-coverage, [2]Citation 2.WHO Immunization Data portal - Detail Page. Immunization Data. Accessed April 2, 2024.
https://immunizationdata.who.int/global/wiise-detail-page/measles-vaccination-coverage
Vaccination helps control measles and changes the epidemiology of the disease.
These changes are due to:
The vaccine’s mechanism of action: the vaccine protects individuals from infection; it reduces the number of susceptible individuals and, as a result, transmission of the virus.
Vaccination coverage: when more than 95% of the population is immunised, transmissions is reduced and the risk of exposure to the virus is low for the whole population. This is known as community, or herd, immunity; non-immunised people are protected by the size of the immunised group around them.
High vaccination coverage will:
Reduce the group of susceptibles
Reduce the measles incidence and mortality rate
Increase the proportion of immunised people among the cases
Alter the age distribution of cases
Increase the time between outbreaks.
Incidence, mortality, and time between outbreaks
When vaccination coverage increases and stays at a high level, there is a decline in the incidence and more widely spaced outbreaks. Only maintaining very high vaccination coverage (over 95%) can prevent outbreaks.
The figure below shows schematically how the measles incidence and risk of an outbreak vary as a function of vaccination coverage obtained by primary vaccination (one dose starting at age 9 months).
Figure 1.6 - Vaccination coverage, incidence, and time between outbreaks
Low vaccination coverage (below 50%) | |
Incidence in the population is high, with intense virus transmission. Measles is endemic, with closely-spaced spikes (every 1 to 2 years). | 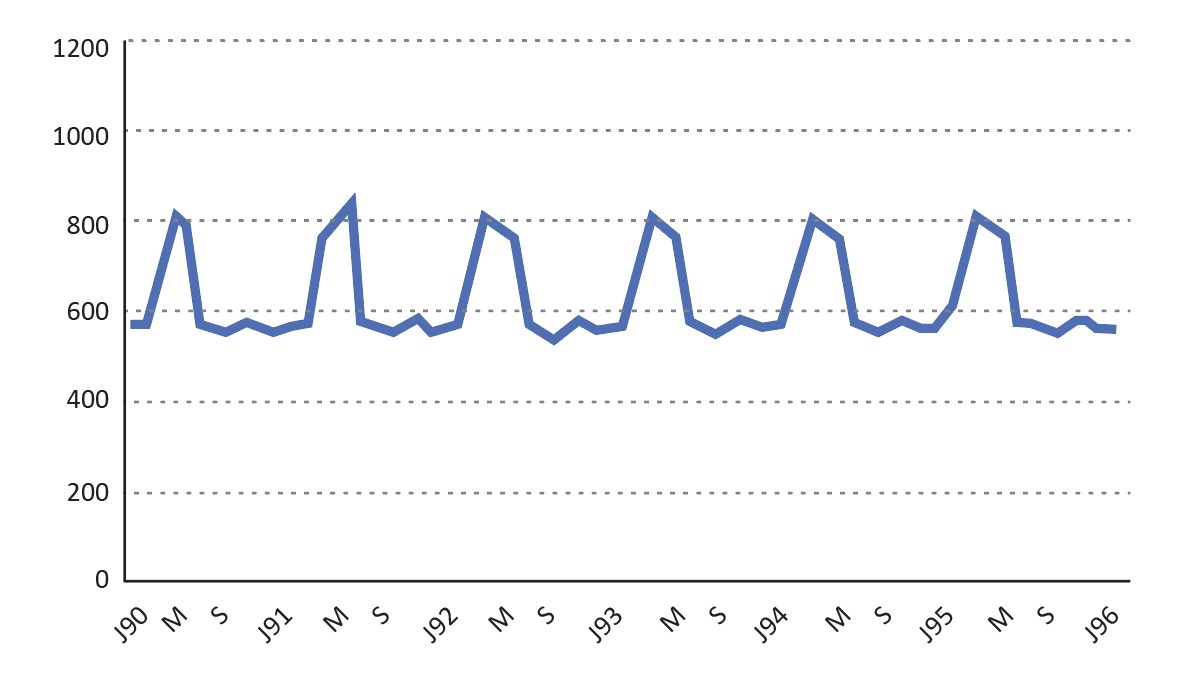 |
Moderate vaccination coverage (60-80%) | |
The incidence decreases substantially in the population. Virus transmission remains high. Measles is still endemic, but with a lower incidence and more widely-spaced spikes (every 2 to 4 years). | 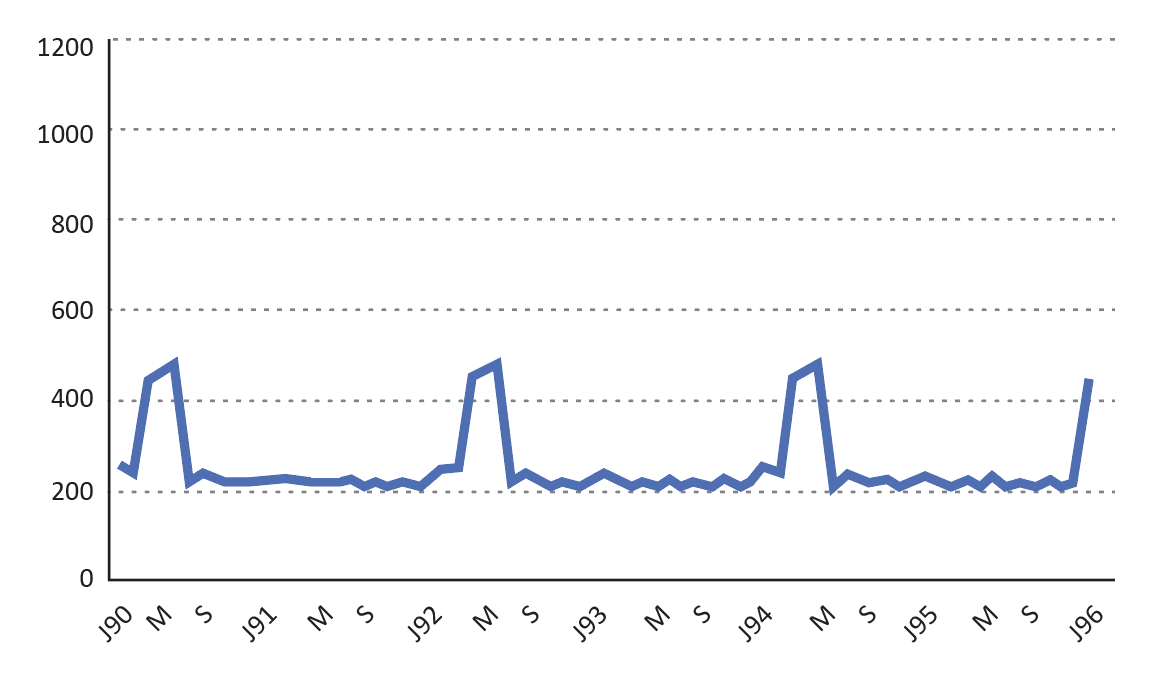 |
High vaccination coverage (over 80%) | |
Incidence in the population is low, The number of cases has plummeted. The virus is still being transmitted, but less intensely. Measles is still endemic, but less intense, with very widely-spaced spikes (every 4 to 8 years). | 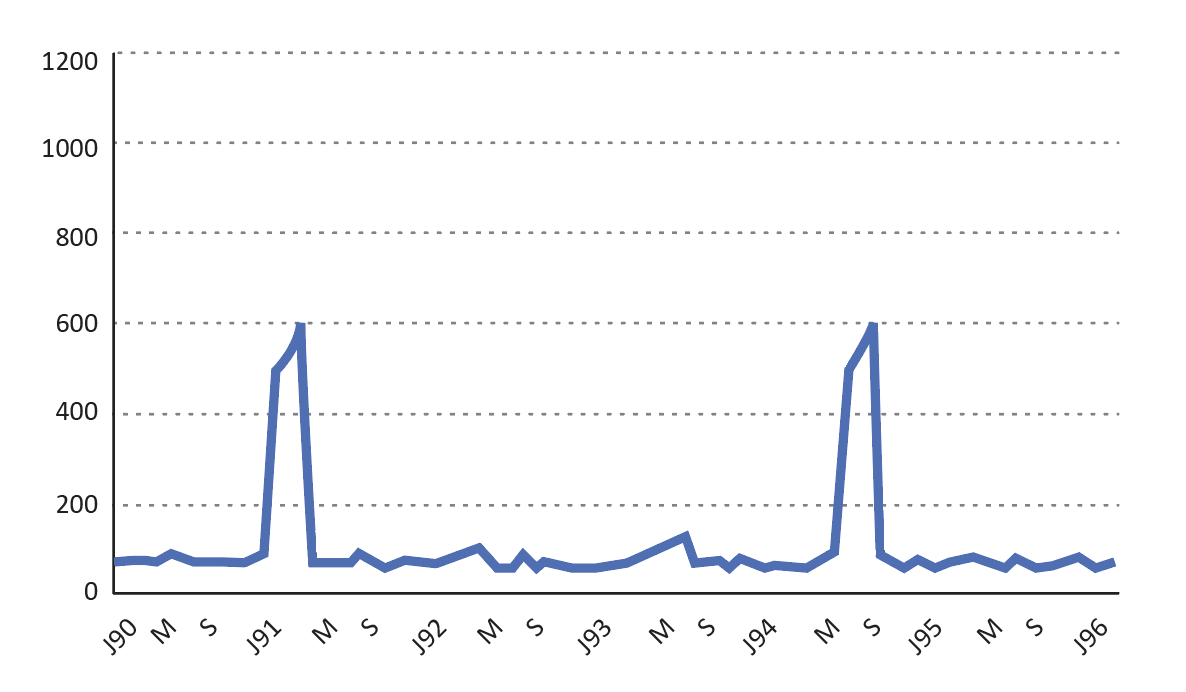 |
Source : MSF/Epicentre
The group of susceptibles
This group includes unvaccinated people and people who did not respond to vaccination (a single vaccine dose administered starting at age 9 months confers protection in 80 to 95% of children, depending on the study).
Example: Estimating the number of susceptibles in a population of 110,000 children under age 5 years:
| Vaccination coverage 90% | 10% unvaccinated ............11,000 |
| Vaccination efficacy 90% (99,000 vaccinated) | 10% non-responders ..........9,900 |
| Total susceptible .......20,900 |
Assume, in a given population, that:
Measles immunisation activities remain steady (one dose for children ages 9-11 months and achieve 75% coverage, that means that each year, the unprotected portion of the 9- to11-month-olds for that year are added to the susceptibles already present in the population.
There are no additional routine activities (administration of a second dose and/or vaccination campaigns.
Then the virus will continue to circulate in the population, but transmission will be low and few cases will occur.
The number of susceptibles will continue to build from year to year, until it reaches a critical mass. There will then be a significant increase in the number of cases, or even an outbreak affecting the susceptibles in all age groups (including the oldest).
If it were a large-scale outbreak, the majority of susceptibles in the population would be infected and would then be immunised. A new group of susceptibles would begin to form from the new births that year (See Figure 1.7).
Figure 1.7 - Example of accumulation of susceptibles over several years
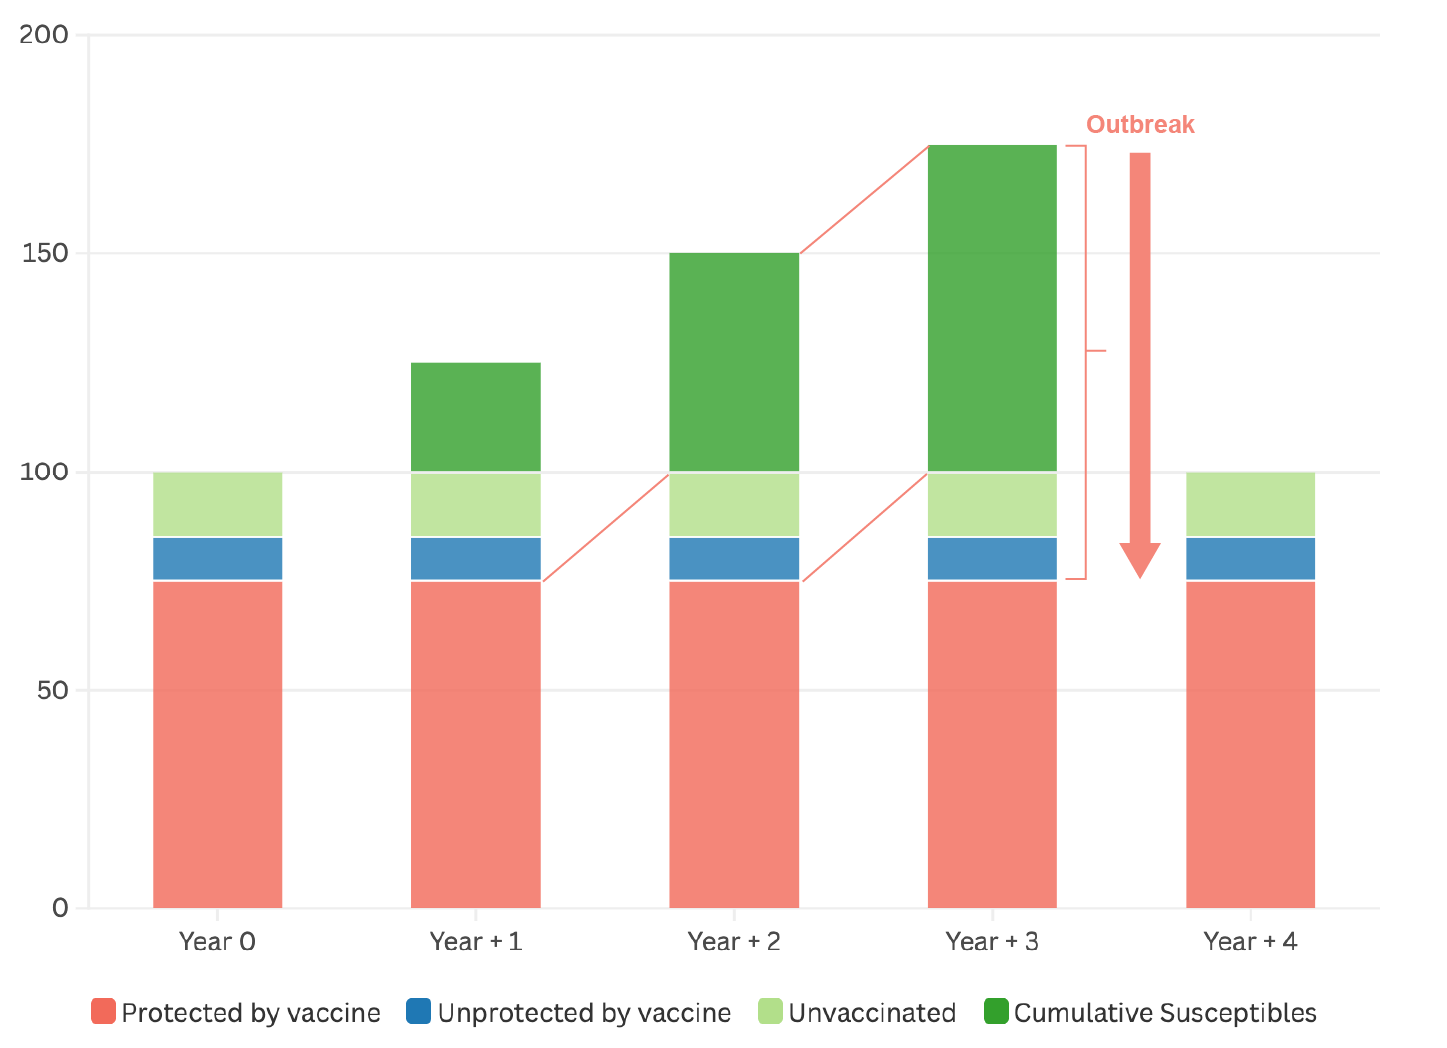
Note: here it is assumed that there were no susceptibles at the start of year 0 and that the outbreak in year + 3 reduced the number of susceptibles to zero by the end of the year, which is never the case in real life.
Proportion of vaccinated among the cases
Increasing the vaccination coverage leads to a sharp decline in the number of cases. At the same time, however, the proportion of vaccinated among the reported cases grows. Most of those cases are therefore due to vaccine failure.
Example of how the proportion of vaccinated among measles cases varies with vaccination coverages of 40 and 80%:
Assumptions: Annual incidence in unvaccinated children: 50% | Vaccination coverage 40% | Vaccination coverage | |
| Total number of children | 100 000 | 100 000 | |
| Unvaccinated | Number of children | 60 000 | 20 000 |
| Number of cases | 30 000 | 10 000 | |
| Vaccinated | Number of children | 40 000 | 80 000 |
| Number of cases | 2 000 | 4 000 | |
| Total number of cases | 32 000 | 14 000 | |
| Proportion of vaccinated among the cases | 6,3% | 28,6% | |
1.2.2 Risk factors for an outbreak
It is important to clearly identify the risk factors for outbreaks and prioritise prevention and response activities. The risk factors have to do with the size of the susceptible group and the frequency of exposure to the virus.
Size of the susceptible group
If the birth rate is high (≥ 4%), the proportion of children (and thus the size of potential susceptible group) is large.
If the vaccination coverage is too low, the number of susceptibles will continue to accumulate from year to year, rapidly reaching critical mass (see Figure 1.7). When the number of susceptibles in the population is greater than an annual birth cohort, the WHO considers the outbreak risk very high [3]Citation 3.Weekly epidemiological record Relevé épidémiologique hebdomadaire [Internet]. World Health Organization. Available from: https://iris.who.int/bitstream/handle/10665/255149/WER9217.pdf?sequence=1 .
Frequency of exposure to the virus
The higher the population density, the greater the number of people exposed to an intense transmission focus, due to crowding. The risks are higher for:
People living in poor urban settings
Displaced or refugee populations
People in contact with a case in healthcare facility waiting rooms (poor ventilation, people gathered together, and the presence of measles cases)
People in institutional settings (paediatrics departments, schools, orphanages, feeding centres, prisons, etc.)
A sick child’s family members (household transmission).
When there is limited access to care, fewer children are vaccinated (reduced access to vaccination) and measles is diagnosed later (more people at risk of contact with the patient).
1.2.3 Description of outbreaks
Seasonality and spread
In tropical areas, transmission increases at the end of the rainy season and intensifies throughout the dry season.
In temperate areas, cases typically occur at the end of winter and beginning of spring.
Classically, the disease spreads from high population density to low population density areas.
In rural settings, where transmission is lower, epidemic outbreaks are generally localised, more widely spaced, and smaller in scale than in urban settings.
Duration and size
Outbreaks can last anywhere from a few weeks to several months.
A study (see below) on five urban outbreaks where there was no early intervention showed outbreaks lasting longer than six months, and a widely varying number of cases (from 2,500 to more than 53,000).
Figure 1.8 - Duration and size of outbreaks; some examples
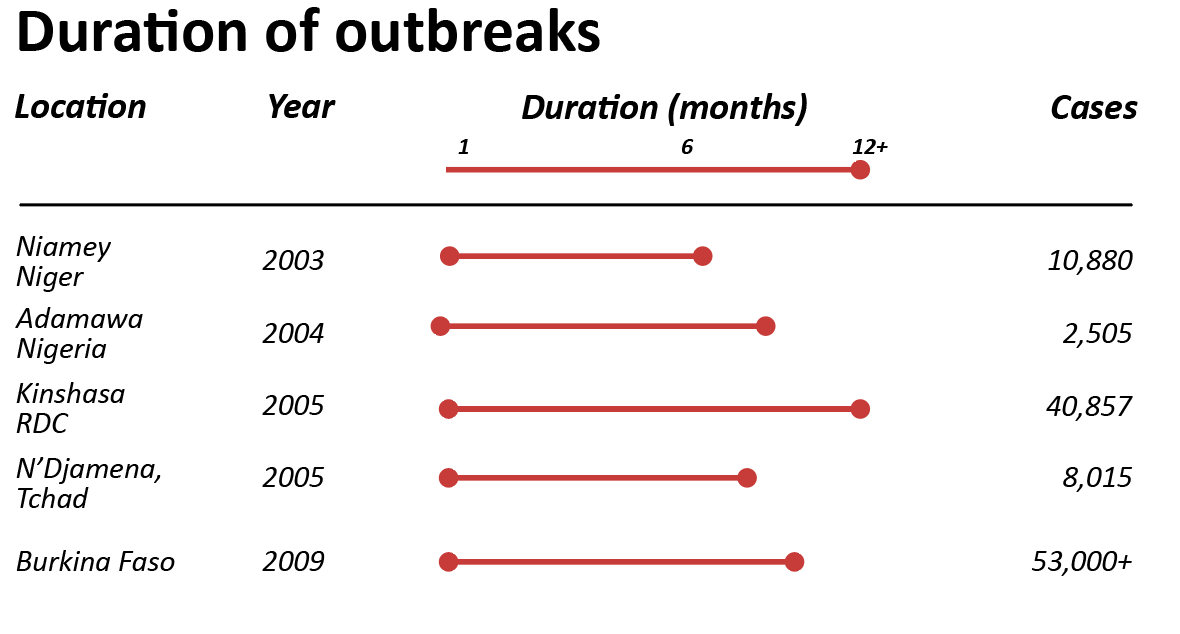
The duration and size of outbreaks are related to:
The size and density of the exposed population
How fast the disease spreads
The prior vaccination coverage and the size of the susceptible cohort
The mobility of the population (susceptibles entering and leaving)
How fast outbreak response vaccination is put in place.
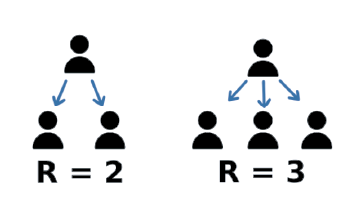
Speed of spread
The reproduction number (R) represents the average number of secondary cases produced from a source case. It is the indicator used to estimate the speed with which an outbreak is growing. When its value is 1, each case can infect one additional person and the transmission rate will be stable, indicating endemic transmission. Values greater than 1 indicate epidemic transmission. The higher the reproduction number, the faster the outbreak spreads.
The reproduction number depends on several factors:
The contagious period of the disease
The probability of disease transmission at each contact
The number of susceptible people in the population
The level of contact between individuals in a population.
The basic reproduction number (R0) corresponds to the value of R in a population where all individuals are susceptible to the disease (unprotected). R0 for measles is high; the exact value varies by context. The literature suggests that each measles case can infect twelve to eighteen people
[4]Citation 4.Guerra FM, Bolotin S, Lim G, et al. The basic reproduction number (R₀) of measles: a systematic review. Lancet Infect Dis. 2017;17(12):e420-e428.
https://doi.org/10.1016/s1473-3099(17)30307-9
, and some studies cite a potentially much broader range.
In places where the population is partially vaccinated or has already been hit by the virus (which is now the case everywhere in the world), the reproduction number is lower and is called the effective reproduction number. The effective reproduction number estimates the value of R0 in reality, taking into account the level of non-susceptible individuals in the population (due to vaccination or prior infection). The effective reproduction number is useful for determining whether an outbreak will continue to grow, and how fast. Values greater than 1 indicate that the outbreak is still in its growth phase
[5]Citation 5.Grais R, Ferrari MJ, Dubray C, Bjørnstad ON, Grenfell BT, Djibo A, Fermon F, Guérin PJ. Estimating transmission intensity for a measles epidemic in Niamey, Niger: lessons for intervention. Trans R Soc Trop Med Hyg. 2006;100(9):867-873.
doi: 10.1016/j.trstmh.2005.10.014
.
Appendix 1 presents two examples of measles outbreaks and outbreak response vaccination.
- 1.
WHO Immunization Data portal - Detail Page. Immunization Data. Accessed April 2, 2024.
https://immunizationdata.who.int/global/wiise-detail-page/measles-vaccination-coverage - 2.
WHO Immunization Data portal - Detail Page. Immunization Data. Accessed April 2, 2024.
https://immunizationdata.who.int/global/wiise-detail-page/measles-vaccination-coverage - 3.
Weekly epidemiological record Relevé épidémiologique hebdomadaire [Internet]. World Health Organization. Available from: https://iris.who.int/bitstream/handle/10665/255149/WER9217.pdf?sequence=1
- 4.
Guerra FM, Bolotin S, Lim G, et al. The basic reproduction number (R₀) of measles: a systematic review. Lancet Infect Dis. 2017;17(12):e420-e428.
https://doi.org/10.1016/s1473-3099(17)30307-9 - 5.
Grais R, Ferrari MJ, Dubray C, Bjørnstad ON, Grenfell BT, Djibo A, Fermon F, Guérin PJ. Estimating transmission intensity for a measles epidemic in Niamey, Niger: lessons for intervention. Trans R Soc Trop Med Hyg. 2006;100(9):867-873.
doi: 10.1016/j.trstmh.2005.10.014