The aim of the investigation is to collect the data needed to confirm the outbreak and analyse the initial actions taken in response, and to issue recommendations on the intervention strategy, if necessary.
The effectiveness of the response (controlling the spread of the outbreak by organising a large-scale vaccination campaign) depends largely on how quickly the outbreak is identified.
The investigation must therefore start at the first warning signs, i.e. an increase in the number of cases compared to the same period in previous (non-epidemic) years, a significant increase in cases over the past three weeks, or predefined alert criteria.
In principle, if the epidemiological surveillance system is functional and responsive, the alert will be issued as soon as the outbreak begins.
3.2.1 Defining cases
The description of an outbreak rests on the case definition. The case definition should be clear, simple and standardised, so that it can be used at all levels from health post to hospital. It should remain constant for the duration of the outbreak. Standardisation allows uniform data collection, i.e. the number of cases and deaths, the age groups at risk and the geographic extent.
The following (WHO-recommended) case definitions are given as an illustration:
| Suspected case | Any person in whom a clinician suspects measles infection OR Fever ≥ 38 °C AND Generalised maculopapular rash (non-vesicular) AND One of the following signs: cough or coryza or conjunctivitis |
|---|---|
| Probable case | Suspected case AND Recent contact with a laboratory-confirmed case |
| Confirmed case | Suspected or probable case AND Laboratory confirmation |
All case definitions are a compromise. A sensitive but relatively nonspecific definition will include all of the cases, but will also include patients who are not cases (overestimation).
Conversely, if the definition is highly specific, all cases counted will be true cases, but some true cases will not be included (underestimation).
3.2.2 Confirming the diagnosis
Most of the time, the diagnosis is clinical (based on the definition of a suspect case).
Prior to the eruptive (rash) phase, suspicion of the disease is based only on contact with a patient and no past history of measles. After the eruptive phase, it requires a differential diagnosis from other febrile eruptive illnesses and drug reactions (See Chapter 5, Section 5.1.3).
Laboratory confirmation
[1]Citation 1.World Health Organization. Rougeole: Normes de surveillance des maladies évitables par la vaccination [Internet]. Geneva: World Health Organization; 2024 [cited 2024 Apr 4]. Available from:
https://www.who.int/fr/publications/m/item/vaccine-preventable-diseases-surveillance-standards-measles
Laboratory testing is crucial to confirm an outbreak and essential to declaring one, but inability to get laboratory confirmation should never delay treatment for patients or preparations for outbreak response.
At the start of the high-risk season, specimen collection equipment should be made available at all levels (hospitals, health centres, etc.) and staff should be trained in its use so that samples can be taken at the first contact with the patient.
At a minimum, specimens should be collected on the first five to ten reported cases in a newly affected geographic area.
Available diagnostic methods
- Indirect technique: serology, presence of immunoglobulin M (IgM) (ELISA). This is the gold standard for investigating an outbreak. Serological testing for IgM antibody is most sensitive if done between the 3rd and 28th day after onset of the skin rash. It should therefore be done during that period, if possible.
- Direct techniques (RT-PCR, sequencing and culture) are not appropriate for investigating an outbreak (as they are only available in certain laboratories) but can be used for early diagnosis (< 7 days), for studying the genome, or for isolating the virus.
- Rapid diagnostic tests are currently being studied and should be available for use in coming years to quickly guide initial actions and target patients to be sampled for laboratory confirmation.
Specimen collection methods (Appendix 4):
- Collecting capillary blood, dried, on filter paper for detection of IgM or IgG
- Collecting whole blood or serum by venipuncture for detection of IgM or IgG
- Swabbing the nasopharyngeal mucosa or collecting a saliva sample for RT-PCR detection
of viral RNA (MSF does not recommend this for outbreak investigation)
Follow the country’s Ministry of Health recommendations for choosing the type of sample and for collection and transport procedures.
Ensure that serological testing for rubella is done routinely for all negative measles results.
Provided the Ministry of Health recommends this type of sample, and the laboratory can do the analysis, dried blood samples are preferable to serum because:
- Their sensitivity and specificity in detecting specific IgM antibodies are equivalent to that of serum
- They do not require venipuncture
- The samples are stable for about 7 days without a cold chain
After labelling the sample and completing the sample register (Appendix 2), promptly send the specimen to the laboratory accompanied by a completed information form (Appendix 3).
| During an outbreak, laboratory confirmation testing is done on the first several cases (in each geographic area). Once measles is confirmed, epidemiological surveillance relies on the clinical definition (suspected cases). |
3.2.3 Counting cases and deaths
The methods for finding cases will depend on the population in question and the existing surveillance system. Cases and deaths are looked for and counted:
In health care facilities:
- At hospitals, health centres, dispensaries and feeding centres (counting the cases in the registers or consulting line lists).
Using community-based surveillance:
- In schools and other places where there are groups of children
- In the villages, by questioning the village heads and visiting the families of reported cases;
- In cemeteries, to estimate the number of deaths.
Community health workers should therefore have a simple case definition (fever + rash) that permits them to detect cases and refer them to a health facility.
If health care facilities do not have measles registers and/or line lists, put them in place (Appendix 5.1 and Appendix 5.2).
For each reported case, collect the following information: name, date of birth (or age, if date of birth unavailable), sex, address, date symptoms began, admission date, treatment, outcome (recovery, death, or transfer), vaccination status, laboratory diagnosis, etc.
To avoid double reporting, it is essential to specify how transferred cases are counted.
In theory, counting measles-related deaths that occur both in the acute phase and within 30 days after the first signs is recommended. In practice, this is often hard to put in place and the deaths are often underestimated.
| Cases are reported from the beginning to the end of the outbreak. |
3.2.4 Demographic data
The demographic data provide the denominator needed for calculating several indicators (incidence, attack rate, and vaccination coverage, See Section 3.2.6).
Reliable demographic data can be hard to get, particularly when there are no public records or a recent census. Be aware of over- and underestimates, depending on the source.
It is important to get the most accurate possible data. Compare the data from several different sources. Justify the choice of data used and give the source. There should be consensus among the main partners.
For example, demographic data from an old census can be used by applying the hypothetical annual population growth rate.
Local authorities might have more recent population figures than those available at the national level.
Everyone involved in managing the outbreak must use the agreed-upon population data until the end of the outbreak.
3.2.5 Organising the data
This is the descriptive stage of the outbreak investigation. The situation is described in terms of time, place and person.
Time
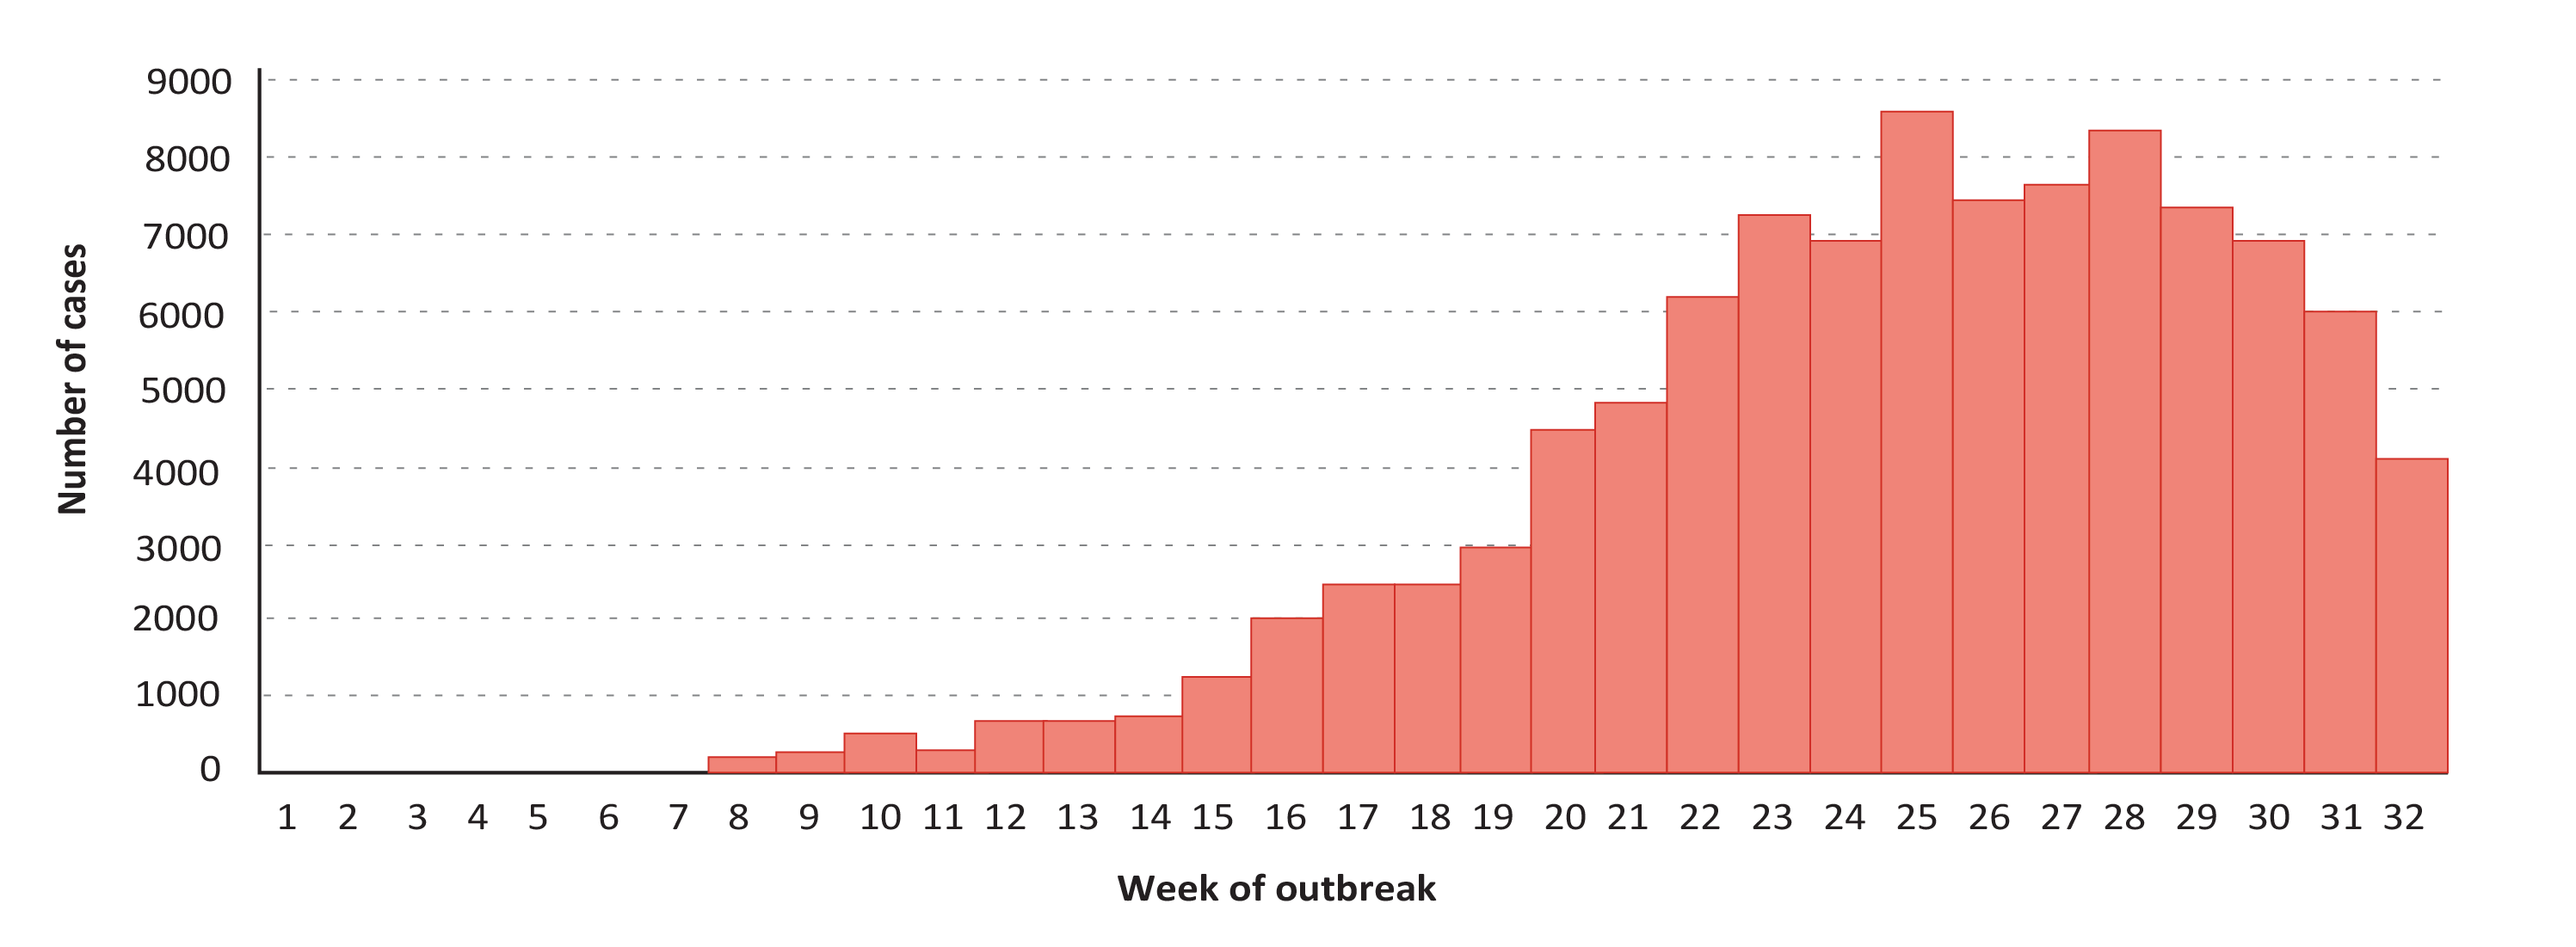
The data are transferred chronologically from the data collection tables (Appendix 6) onto a graph. The epidemic curve obtained represents the distribution of cases by date of diagnosis (Figure 3.1).
This curve allows confirmation that there is an outbreak and, if updated on a regular basis, also helps monitor the time course of the outbreak and assess the efficacy of the response.
Figure 3.1 - Reported measles cases by week, Malawi, 2010
[2]Citation 2.Minetti A, Kagoli M, Katsulukuta A, et al. Lessons and challenges for measles control from an unexpected large outbreak, Malawi. Emerg Infect Dis. 2013;19(2):202-209. doi:10.3201/eid1902.120301
Source: this publication is in the public domain and is therefore not subject to copyright. The texts and graphs presented in this paragraph are not reproduced in this article as such, but are taken from the study carried out by MSF and Epicentre, of which the latter are among the authors.
Place
The geographic distribution of cases or the attack rates specific to each geographic area (district/neighborhood/city or section of a refugee camp) help visualize the geographic spread of the epidemic to date.
The distribution of cases or the cumulative incidence rate over the past 3 to 4 weeks helps identify the highest-risk areas at a given moment, to set priorities for response. Epidemic curves by geographic areas can also provide information on the different stages of the epidemic's progression.
Figure 3.2 - Geographic distribution of measles cases, Week 25, Malawi, 2010 [2]Citation 2.Minetti A, Kagoli M, Katsulukuta A, et al. Lessons and challenges for measles control from an unexpected large outbreak, Malawi. Emerg Infect Dis. 2013;19(2):202-209. doi:10.3201/eid1902.120301
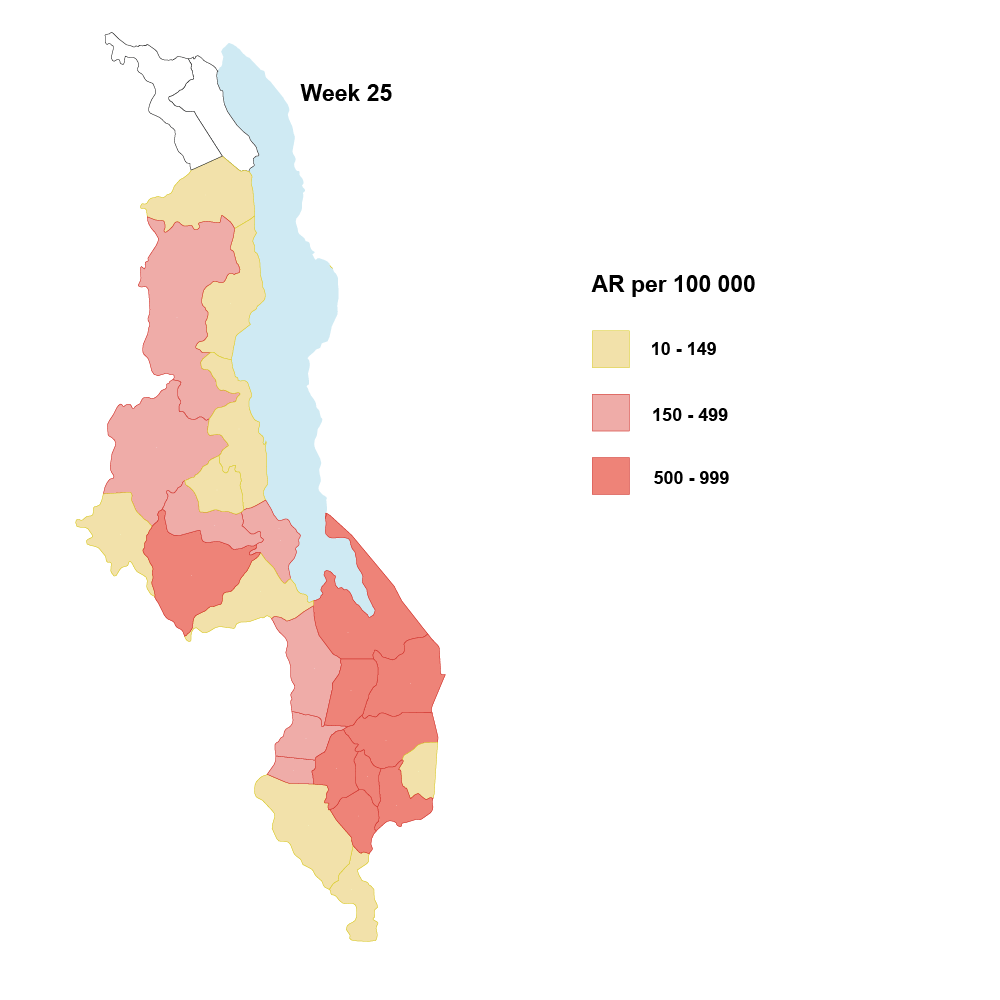
Source: this publication is in the public domain and is therefore not subject to copyright. The texts and graphs presented in this paragraph are not reproduced in this article as such, but are taken from the study carried out by MSF and Epicentre, of which the latter are among the authors.
Person
While it is essential to determine the age of the cases, gender may also be a consideration.
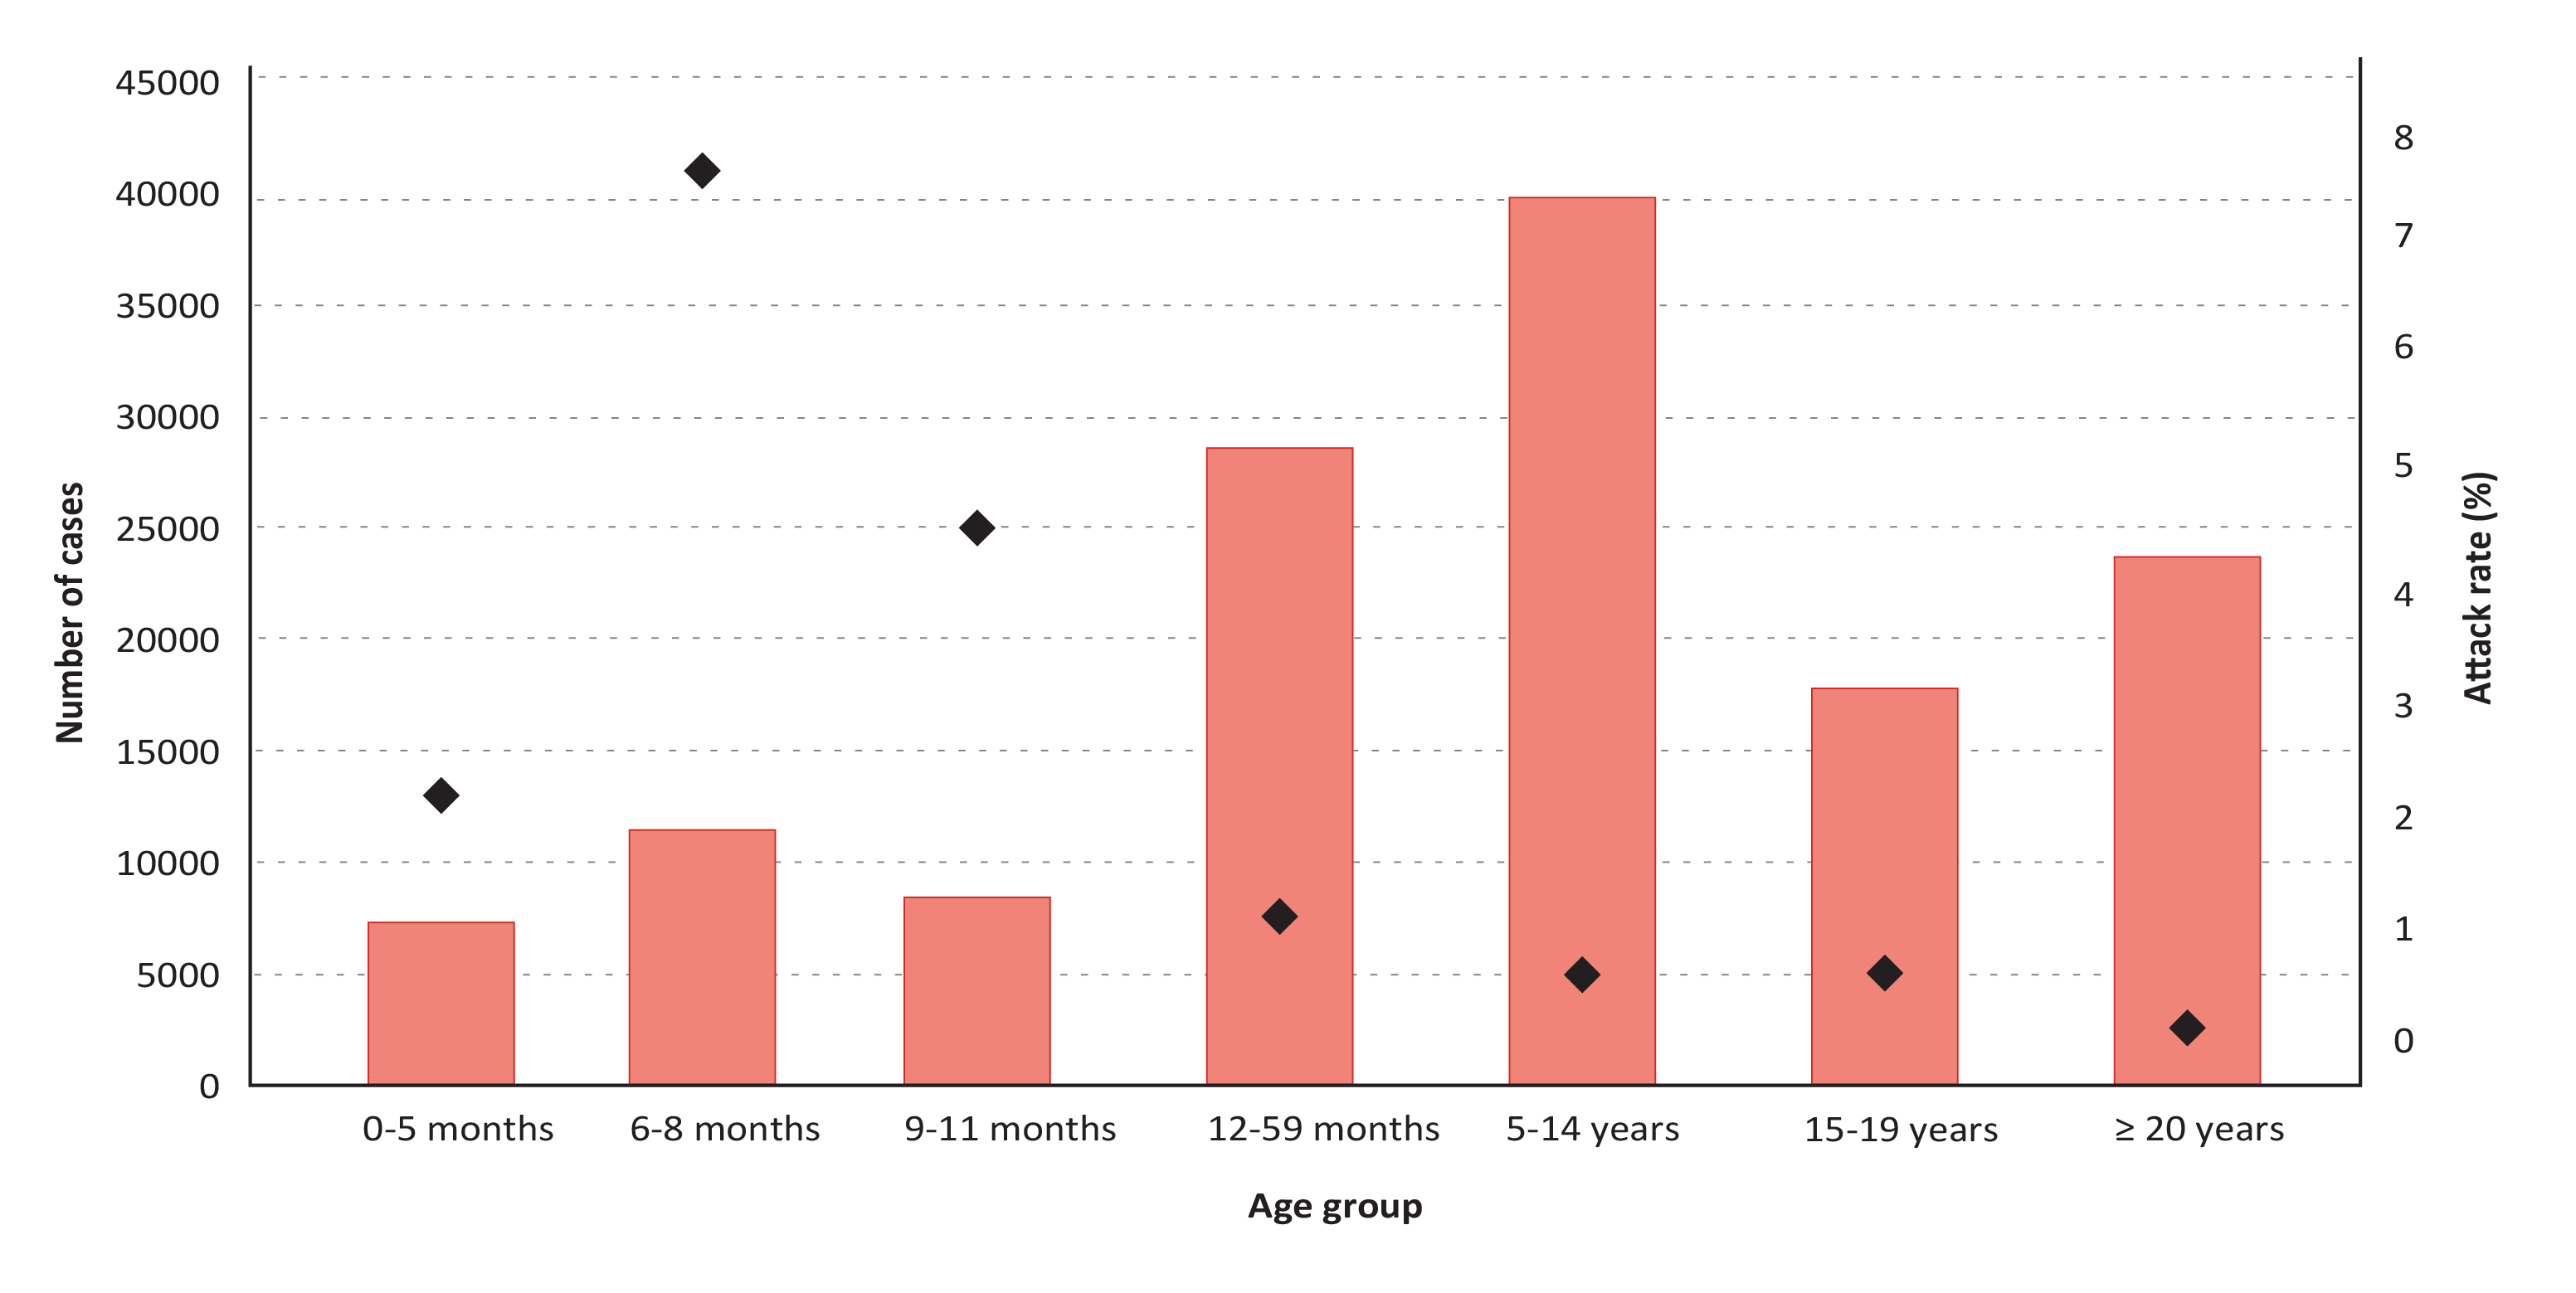
The hardest-hit age groups are identified by calculating the age-specific attack rate. This indicator is critical in defining the target population for the vaccination campaign.
The suggested age groups to look at are 0-5 months, 6-8 months, 9-11 months, 12-59 months, 5-14 years and ≥ 15 years. Depending on the context, it may be necessary to divide the data into other age groups, e.g., 5-9 years and 10-14 years for children and 15-29 and ≥ 30 years for adults (Figure 3.3).
If the available demographic data do not include the distribution by age group, it is often possible to calculate it from the total population and national data used by other programmes (e.g. EPI). Failing that, use the standard population distribution (Appendix 7).
Figure 3.3 - Measles attack rate by age group, Malawi, 2010
[2]Citation 2.Minetti A, Kagoli M, Katsulukuta A, et al. Lessons and challenges for measles control from an unexpected large outbreak, Malawi. Emerg Infect Dis. 2013;19(2):202-209. doi:10.3201/eid1902.120301
Source: this publication is in the public domain and is therefore not subject to copyright. The texts and graphs presented in this paragraph are not reproduced in this article as such, but are taken from the study carried out by MSF and Epicentre, of which the latter are among the authors.
3.2.6 Analysing the data
Analyse these data to:
- Determine the speed with which the outbreak is spreading, and its size (epidemic curve)
- Identify the at-risk population (age groups and place)
- Plan and adjust the response, in order to limit the number of cases and deaths and the spread of the outbreak (estimate the needs in terms of treatments, vaccine doses, etc.)
The main indicators to calculate at each level (region, district, town, etc.) are:
- The weekly and cumulative incidence (attack rate)
- The specific attack rate:
- By place (neighbourhood, health zone, commune, refugee camp zone)
- By age group
- The weekly and cumulative case fatality rate:
- By age group
- By treatment site (e.g. in-hospital mortality)
| The analysis of the overall case fatality rate data (including both hospitalised and outpatient cases) is difficult because deaths due to complications in outpatient cases are often under-reported and sometimes go uncounted. |
Weekly incidence
This is the speed with which a disease appears in the population during a given period. It is calculated each week during an outbreak.
Number of new cases during the week in question x 100,000 |
Total population |
Example: in Week 3, there were 85 measles cases reported out of a population of 542,080. The incidence was: 85/542,080 x 100,000= 15.7/100,000.
Attack rate
The attack rate is a particular form of the incidence. It is a cumulative incidence, calculated over a short period of time – since the start of the outbreak, in particular.
Number of new cases during a given period x 100 |
Population exposed to the risk of the disease during the same period |
The attack rate can also be calculated for a given population – for example, a particular age group.
Example: there were 3,022 cases of measles reported in children under age 1 year during the four months of the outbreak. There were 20,057 children in that age group (3.7% of the population).
The measles attack rate in children < 1 year was: 3,022/20,057 x 100 = 15.1%.
Case fatality rate
The case fatality rate (CFR) is the percentage of deaths among cases of a disease. It is an indicator of the severity of the disease and the quality of patient management.
Number of deaths due to measles in a given place during a given period x 100 |
Number of measles cases reported in the same place during the same period |
Example: of the 3,022 cases of measles reported in children under age 1 year, 250 died. 472 of them were treated at the hospital, where 118 of them died:
- The CFR for children under 1 year was: 250/3,022 x 100 = 8.3%
- The in-hospital mortality for children under 1 year was: 118 / 472 x 100 = 25%
- 1.
World Health Organization. Rougeole: Normes de surveillance des maladies évitables par la vaccination [Internet]. Geneva: World Health Organization; 2024 [cited 2024 Apr 4]. Available from:
https://www.who.int/fr/publications/m/item/vaccine-preventable-diseases-surveillance-standards-measles - 2.
Minetti A, Kagoli M, Katsulukuta A, et al. Lessons and challenges for measles control from an unexpected large outbreak, Malawi. Emerg Infect Dis. 2013;19(2):202-209. doi:10.3201/eid1902.120301